


-
ChatterFeed
-
0Best Answers
-
2Likes Received
-
0Likes Given
-
6Questions
-
0Replies
Einstein Analytics Dataset Utilities
Hi guys! What's Up?
I'm working with Einstein Analytics and I need to extract my Dataset in Excel format. Currently I'm using Einstein Analytics Dataset Utilities, but this tool can return 10k of rows, but my Dataset has 350k, when I try to extract my Dataset It returns an error message "Read Time Out" (Because de great value of rows).
I want to know if you have another way or suggestions to fix this issue.
Thanks and Regards!
-
- Bruno V.
- February 08, 2019
- Like
- 0
- Continue reading or reply
Filter in SAQL
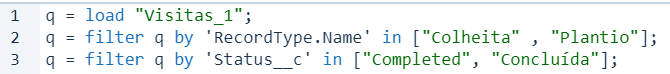
Hi! I'm stucked in one step of SAQL, I need help where my filter applies a condition where it will bring 'Colheita' AND 'Plantio', but in the situation it seeks 'Colheita' OR 'Plantio'.
-
- Bruno V.
- January 18, 2019
- Like
- 0
- Continue reading or reply
Calculation Using Bar Segment
Hi Devs! What's up?
I am developing a chart and I need your opinion if there is a possibility of doing what I am thinking.
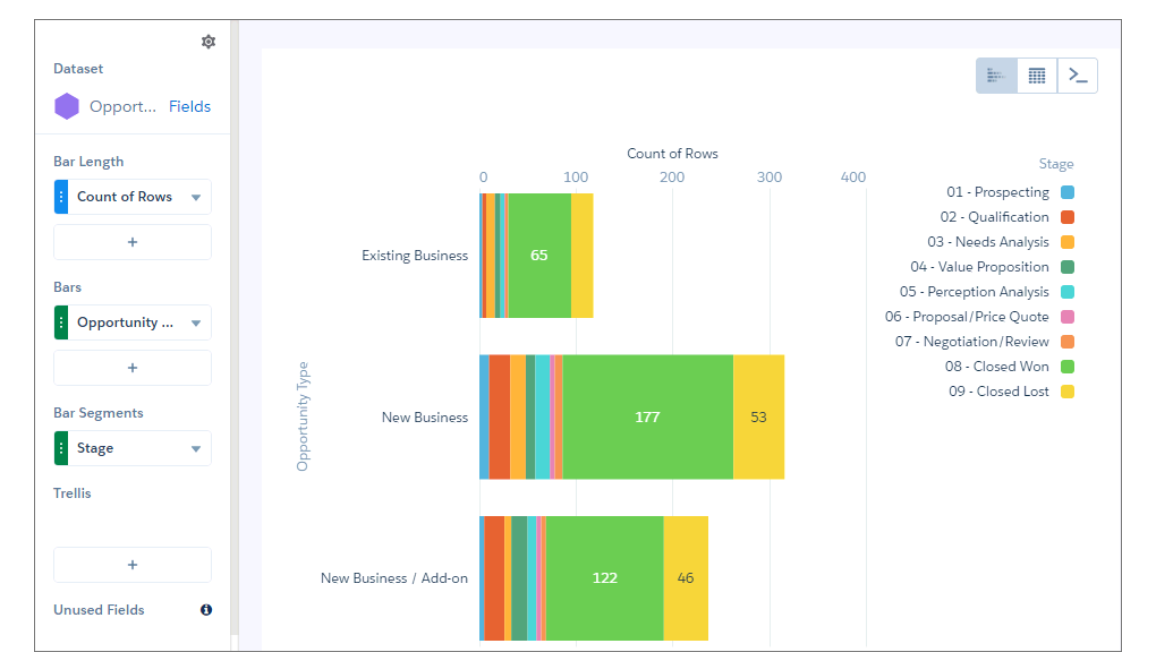
- In the image below, I would like to make a sum with "Prospecting + Qualification + Needs Analysis" and project on the chart as a new Stage called "Start Qualification Analysis". The goal was to reduce the number of stages in small groups.
-Using the same example as the image below, I would like to know how to do the conversion from row count to percentage with the same graphical view. If you have a possibility to do this, I would really like opinions on how to do it (SAQL or other way).
Thank you! :)
I am developing a chart and I need your opinion if there is a possibility of doing what I am thinking.
- In the image below, I would like to make a sum with "Prospecting + Qualification + Needs Analysis" and project on the chart as a new Stage called "Start Qualification Analysis". The goal was to reduce the number of stages in small groups.
-Using the same example as the image below, I would like to know how to do the conversion from row count to percentage with the same graphical view. If you have a possibility to do this, I would really like opinions on how to do it (SAQL or other way).
Thank you! :)
-
- Bruno V.
- January 10, 2019
- Like
- 0
- Continue reading or reply
Windowing Function - Help
Hi Devs! I'm starting a SuperBadge in Einstein Analytics (Einstein Analytics and Discovery Insights Specialist), currently doing the first challenge.
We need to do a chart that shows this fómula:
:
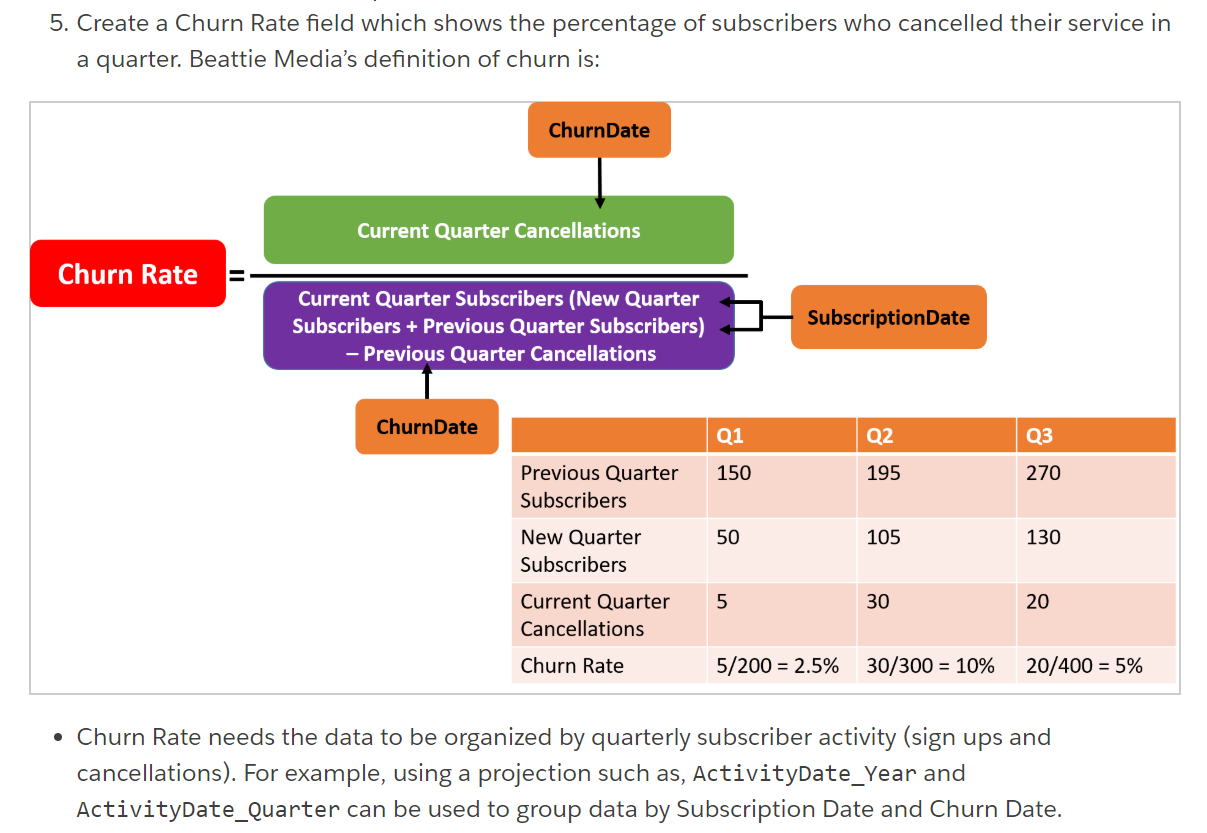
I already got Current Quarter Cancellations, but I can't do this purple square. How can I get previous quarter cancellations and subscribers?
I'm reading about windowing function, but I can't build my code.
Thanks <3
We need to do a chart that shows this fómula:
:
I already got Current Quarter Cancellations, but I can't do this purple square. How can I get previous quarter cancellations and subscribers?
I'm reading about windowing function, but I can't build my code.
q = load "Beattie_Subs";
q = filter q by 'Churn' == "Yes";
q = group q by ('Churn','Churn_Date_Year', 'Churn_Date_Quarter');
q = foreach q generate 'Churn' as 'Churn', 'Churn_Date_Year' + "~~~" + 'Churn_Date_Quarter' as 'Activity_Date(Year-Quarter)', count() as 'CurrentQuarterCancellations';
q = order q by ('Churn' asc, 'Activity_Date(Year-Quarter)' asc);

q1 = foreach q generate 'Churn_Date_Year' + "~~~" + 'Churn_Date_Quarter' as 'Activity_Date(Year-Quarter)', count() as CurrentQuarterCancellations;
sum(count(CurrentQuarterCancellations)) over ([-1 .. -1] partition by (Churn_Date_Year, Churn_Date_Quarter) order by 'Churn_Date_Year' + "~~~" + 'Churn_Date_Quarter');

q = limit q 2000;
Thanks <3
-
- Bruno V.
- January 06, 2019
- Like
- 1
- Continue reading or reply
Super Badge - Einstein Analytics e Discovery Insights - Challenge 1
Hi Devs!
I'm a new adventurer in Salesforce and I don't have so much knowledge in developing. So I'm learning about Einstein Analytics and it is my first Superbadge in Trailhead.
I did the previous requires perfectly, like upload files and organize my org, so my question is:
- The first challenge says to do a graph that shows a churn rate (like a image below), but I cannot undertand how to do this formula. I need to do this using SAQL? Can you help me showing how I proceed to do this graph?
Thanks for help! I'm beginner in Salesforce World and I need to get knowledge in this great software!
-
- Bruno V.
- December 28, 2018
- Like
- 0
- Continue reading or reply
SuperBadge: Einstein Analytics and Discovery Insights Specialist - STEP 1
Hi Admins and Developers! What's up?
I'm learning Einstein Analytics and it is my first Superbadge, so I've some questions about it:
1) This first step we need to create a chart that show churn rate from quarter, I'm lost in 5º step, I really don't know how to do this requires to this chart.
I'm grateful for help!
I'm learning Einstein Analytics and it is my first Superbadge, so I've some questions about it:
1) This first step we need to create a chart that show churn rate from quarter, I'm lost in 5º step, I really don't know how to do this requires to this chart.
I'm grateful for help!
-
- Bruno V.
- December 27, 2018
- Like
- 1
- Continue reading or reply
Windowing Function - Help
Hi Devs! I'm starting a SuperBadge in Einstein Analytics (Einstein Analytics and Discovery Insights Specialist), currently doing the first challenge.
We need to do a chart that shows this fómula:
:
I already got Current Quarter Cancellations, but I can't do this purple square. How can I get previous quarter cancellations and subscribers?
I'm reading about windowing function, but I can't build my code.
Thanks <3
We need to do a chart that shows this fómula:
:
I already got Current Quarter Cancellations, but I can't do this purple square. How can I get previous quarter cancellations and subscribers?
I'm reading about windowing function, but I can't build my code.
q = load "Beattie_Subs";
q = filter q by 'Churn' == "Yes";
q = group q by ('Churn','Churn_Date_Year', 'Churn_Date_Quarter');
q = foreach q generate 'Churn' as 'Churn', 'Churn_Date_Year' + "~~~" + 'Churn_Date_Quarter' as 'Activity_Date(Year-Quarter)', count() as 'CurrentQuarterCancellations';
q = order q by ('Churn' asc, 'Activity_Date(Year-Quarter)' asc);

q1 = foreach q generate 'Churn_Date_Year' + "~~~" + 'Churn_Date_Quarter' as 'Activity_Date(Year-Quarter)', count() as CurrentQuarterCancellations;
sum(count(CurrentQuarterCancellations)) over ([-1 .. -1] partition by (Churn_Date_Year, Churn_Date_Quarter) order by 'Churn_Date_Year' + "~~~" + 'Churn_Date_Quarter');

q = limit q 2000;
Thanks <3
-
- Bruno V.
- January 06, 2019
- Like
- 1
- Continue reading or reply
SuperBadge: Einstein Analytics and Discovery Insights Specialist - STEP 1
Hi Admins and Developers! What's up?
I'm learning Einstein Analytics and it is my first Superbadge, so I've some questions about it:
1) This first step we need to create a chart that show churn rate from quarter, I'm lost in 5º step, I really don't know how to do this requires to this chart.
I'm grateful for help!
I'm learning Einstein Analytics and it is my first Superbadge, so I've some questions about it:
1) This first step we need to create a chart that show churn rate from quarter, I'm lost in 5º step, I really don't know how to do this requires to this chart.
I'm grateful for help!
-
- Bruno V.
- December 27, 2018
- Like
- 1
- Continue reading or reply